keyboard_arrow_up

BOTTOM-UP APPROaCH

We have developed the BOTTOM-UP approach in such a way that all the activities carried out as well as all the results obtained during the 5 phases are fully valued and taken up in the successive phases. The resulting advantage makes it possible to maintain absolute consistency in the approach and a unique capitalization of information and knowledge in the search for absolute EFFICIENCY.

gemba walk

OBSERVE IN ORDER TO IDENTIFY areas FOR IMPROVEMENT

PHASE 1

In this phase, the activity of the Gemba Walk that we carry out with you, commonly also called the "factory tour", consists in observing, in an active way, the operational functioning of the production or administrative processes that you would like to improve. , in order to :

  • Identify value-creating transactions - VA
  • Identify transactions that do not create value - NVA
  • Identify deviations from the company standard
  • Collect the first data in the form of a Flow Chart
  • Mapping the key process - Value-Chain
  • Identify malfunctions
  • Identify waste
  • Identify areas for improvement


Before operating an activity such as the Gemba Walk, it is absolutely imperative to set the objectives to be achieved, with the management, which will serve as a common thread throughout the 4 phases.

PHASE 2

The digitization of a process using a tool such as Value Stream Mapping allows you to know, control and trace, at all levels and in all detail, each operation as well as each interaction that makes up your Value Chain . You will be able to calculate or measure, via the VSM 4.0 tool, many indicators, for example:

  • OEE
  • Lead Time
  • Process Time
  • Cycle Time
  • VA and NVA
  • Activity ratio
  • etc.

In this 2nd phase, we will recover the cartography as well as all the data of the process that we will have observed, in phase 1, in order to transfer them to the VSM 4.0 tool. Once the process data has been entered, this will allow you to: :

  • Visualize the "current" or "as-is" process as a whole, in a transverse and end-to-end way, from suppliers to customers.
  • Have all the information and other critical parameters of the process in a single repository and in a single database.
  • Calculate and visualize multiple indicators in real time.
  • Develop "projections" or "to-be" improvement scenarios.
  • Simulate different scenarios by comparing the performance of the projected process (to-be) with those of the reference process (as-is).
  • Identify the best scenario to implement thanks to the different simulations carried out according to the objectives to be achieved.
  • Plan and manage the activities/tasks of the implementation of the projected process improvements, in PDCA mode, thanks to the methodology integrated in the VSM
  • Continue to monitor the variations in performance (efficiency) of the projected process and thus identify the next areas for improvement within the Continuous Improvement Process.

The estimated gains from digitalization are:

  • Increased "right first time" by 60%
  • Reduced workload by up to 25%
  • Reduction of cycle times or CT by 40%

VALUE STREAM MAPPING

DIGITIZE THE VALUE CHAIN

3D SIMULATION

DIGITALIZE AND SIMULATE PHYSICAL FLOWS IN 3D

PHASE 3

At the end of phase 2, you have the best scenario for improving your projected process, the best there is since it comes from a series of comparative simulations. In fact, you benefit from a 2D digital graphic visualization of your process but, in fact, what about the control and management of physical flows affecting goods, people, transport, information and even the layout of your workshop and production site or even the architecture of your company's building?

We offer you as a solution, another 4.0 3D modeling tool in order to continue simulations of dynamic types relating to flows, the optimization of physical processes, the development of analyses, the identification and prediction of other improvements, and all thanks to 3D visualization. Additionally, it will also allow you to:

  • Be part of a continuous improvement process
  • Improve the ergonomics of operations and workstations
  • Dimension an existing or new building, workshop, production line or facilities.
  • Automate your supply chain - Supply Chain
  • Optimizing logistics flows and networks
  • Putting people back at the center of the business


The estimated gains thanks to the 3D simulation are:

  • Up to 50% reduction in operational costs.
    Example: Design and sizing of a hospital building.
  • More than 20% increase in performance of a process as well as its TRS 60% up to more than 80%.
    Example: Dimensioning of a production line in the food industry
  • Optimization of +3% of the service rate, going from 96% to 99%.
    Example: Logistics system.
  • ROI less than 2 months.
    Example: Projects in the fields of transport and industry.

PHASE 4

After the completion of phases 1 to 3, the company will realize that it has, on the one hand, a potentially enormous amount of data and, on the other hand, that this data represents an invaluable treasure that can contribute to creating of Added Value, not only for the Value Chain of the process in question but also and above all for the company as a whole.

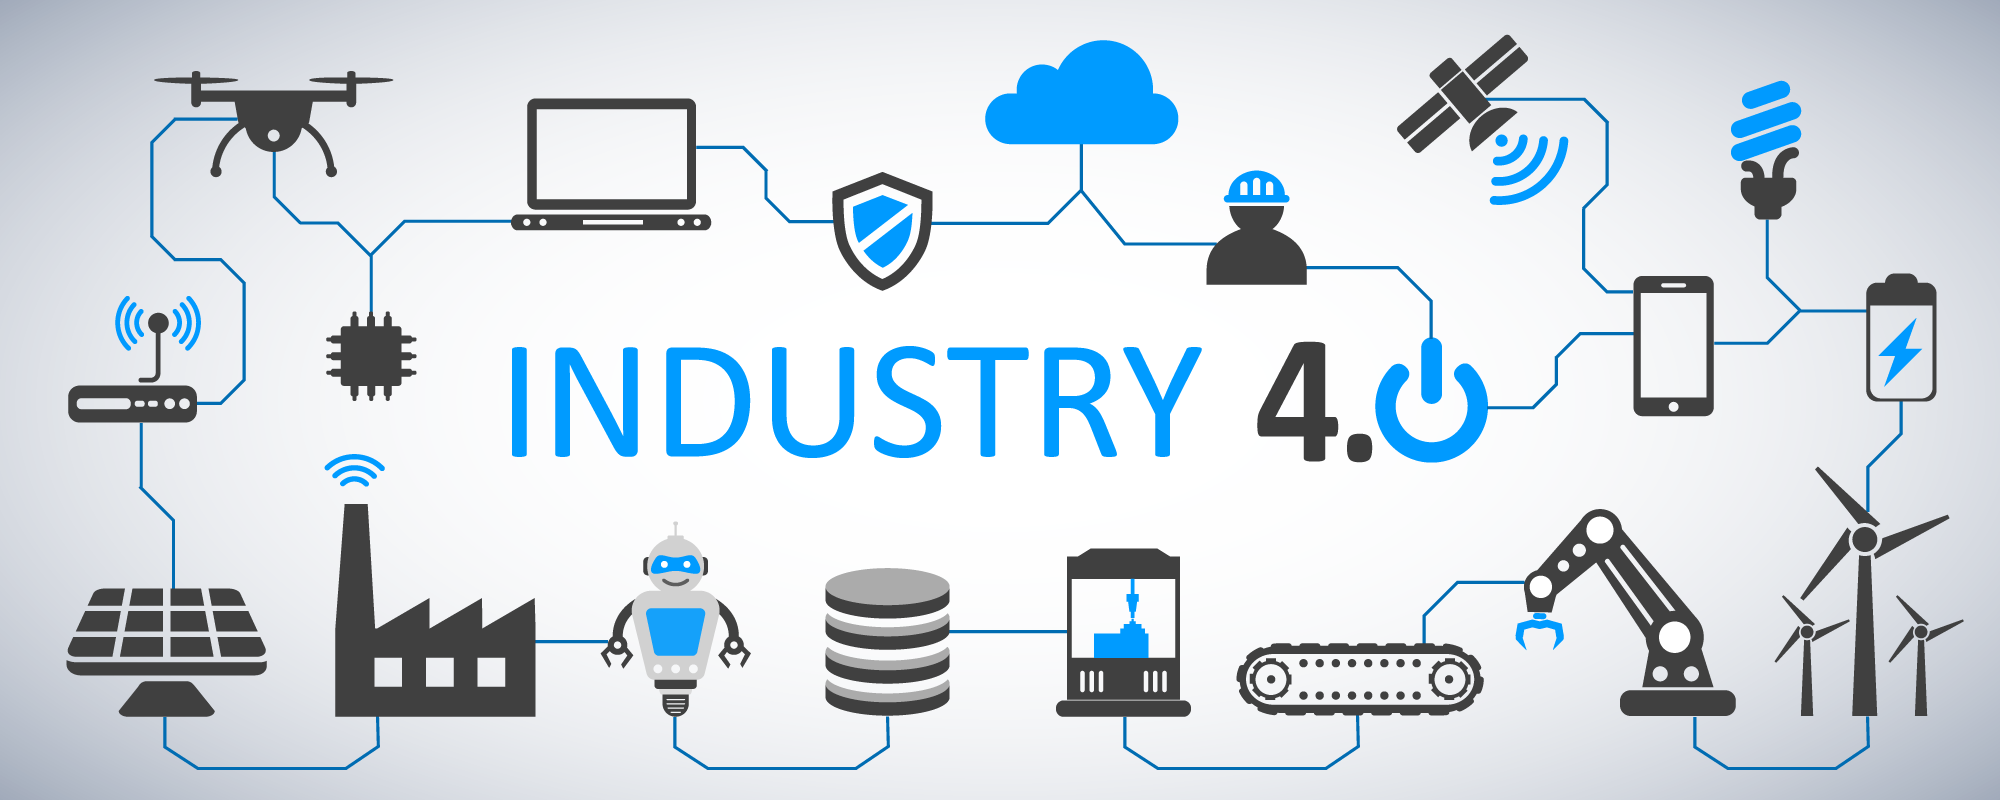
The first vital element in the life of a company is data. The second essential element is measurement. Without measurement or lack or even absence of measurement, it is inconceivable to imagine being able to increase the performance of the company through EFFICIENCY. This is precisely where the IoT or the Internet of Things is essential since it will allow access to all this potential data by means of integration at all levels of the company. In this context, who says accessibility says integration but also says systemic interconnection of all physical elements that make up, not only the production tool such as machines, equipment, installations and other sensors / sensors but also the integration of computer systems like :

  • ERP
      
  • CRM
  • MES
  • PLCM
  • PLC
  • QMS
  • HMI
  • SCM
  • IoT

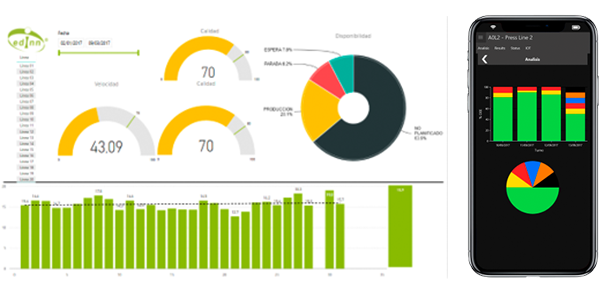
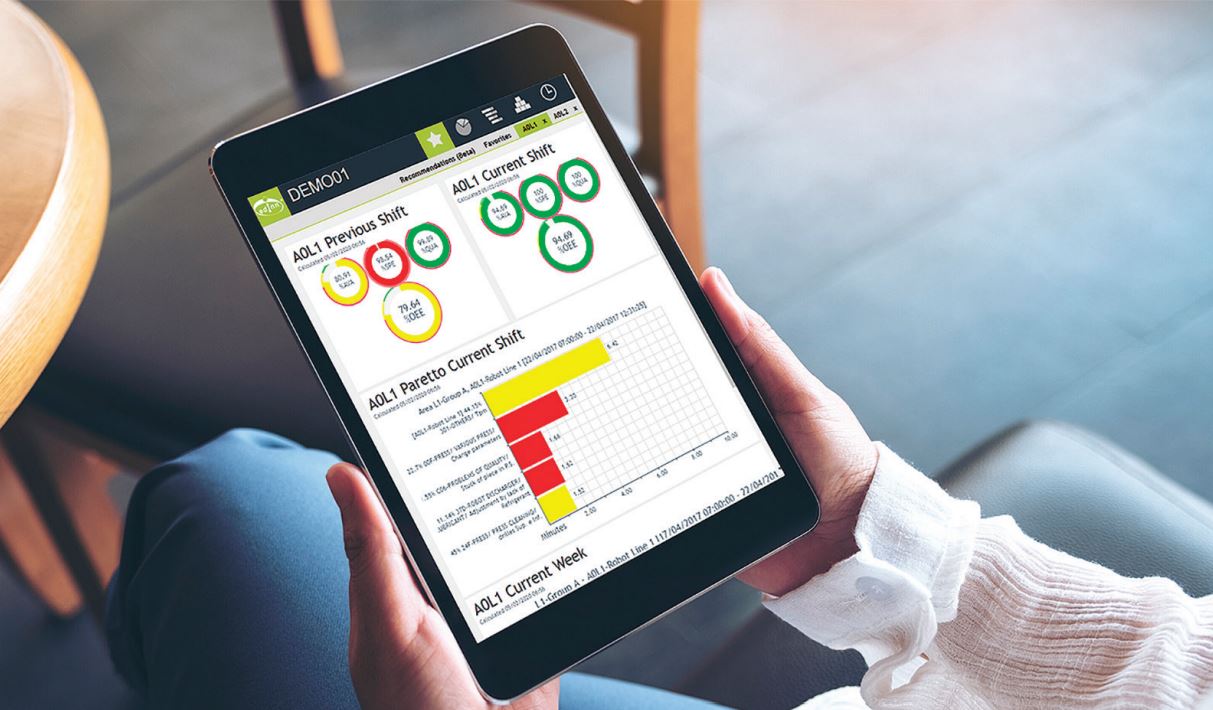
Through the BOTTOM-UP approach, the integration that concerns us is that which goes from the bottom to the top (bottom-up), called Vertical Integration, in reference to the 5 levels characterizing the 4.0 model of the VDMA standard. . This interconnection, unique in industrial history, allows the collection and feedback of data from the production tool as well as those of the company to a common database called BIG DATA. The data is then converted to make it available in a visual, easily accessible and quickly understandable form that can help staff make the right decisions at all times.

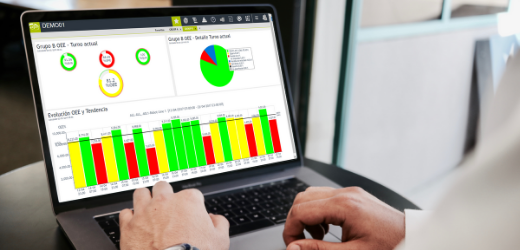
To have a visual management or Visual Management, we offer a solution called MES 4.0 or Manufacturing Execution System which is at the same time, the brain, the heart and the lungs of the vertical integration of data from the IoT to the ERP.

IoT

DIGITIZE CONNECTIONS BETWEEN MACHINES, EQUIPMENT AND OBJECTS FOR VERTICAL DATA INTEGRATION

VISUAL MANAGEMENT

VISUAL MANAGEMENT OF OPERATIONS | MES - MANUFACTURING EXECUTION SYSTEM 4.0

PHASE 5

Visual Management is probably the most prominent Lean Management 4.0 tool because it restores data, information, indicators and other measures in the simplest, easiest to understand and fastest form. : the image. We know the adage that a picture speaks more than 10,000 words.

The visual management that we offer is based on an MES type solution for Manufacturing Execution System. This solution is ranked among the 16 best in the world according to an independent consulting firm. This application is dedicated to SMEs. Among the main functions, the following should be highlighted:

  • Increased EFFICIENCY
  • Quick decision making
  • Availability of real-time information
  • Increase in profitability
  • Cost reduction and production losses
  • Increased product availability
  • Increase in product quality
  • Reduction of energy consumption
  • Integration with the 3D simulation tool


This solution is made up of 14 modules, making it one of the most complete solutions on the market. Its modularity as well as the integrated 4.0 technologies such as IoT, Artificial Intelligence, Big data or Machine Learning easily explain the robustness and reliability of the application:

  • Production Control and Management (OEE)
  • Self-monitoring of maintenance costs
  • Quality management
  • Production planning and scheduling
  • Integration with ERP, SCADA, etc.Big Data type database
  • Predictive maintenance by Artificial Intelligence
  • API application development tool
  • Energy consumption management
  • Production cost management
  • Inventory management with inventory traceability
  • Production staff management
  • Process monitoring and control
  • Work Management, project and task management as well as telework in collaborative mode.


The estimated gains from visual management are:

  • 5% to 40% reduction in operational costs
  • 5% to 40% increase in EFFICIENCY


Advantages

  • Modular solution (14) applicable to all industrial sectors
  • Standard platform allowing a very fast update
  • Easy customization of menus and dashboards
  • Integration with other systems using APIs
  • Easy to use and maintain
  • Implementation of a production line in just 1 week
  • Robust: always reliable information
  • Open solution: product and service oriented
  • Attractive prices for SMEs